Disclosure: HeatLens builds heat loss assessment software. We have a commercial interest in people taking sizing seriously. This piece is written to be checkable rather than persuasive, and the limits of the evidence are set out at the end.
The anecdote is almost always accurate
A familiar article shape: a homeowner replaced a gas boiler with a heat pump, their bills went up, and they wish they hadn't. These pieces attract a lot of irritation from people in this industry, usually on the grounds that they are unrepresentative or unfair.
They are neither, and arguing otherwise is a losing position. The bills really did go up. The homeowner is not confused about their own direct debit.
What is usually wrong is the conclusion — that this is what heat pumps do. That conclusion requires the arithmetic to work out the same way in every house, and it doesn't. Understanding why takes two numbers.
Number one: the bar
UK electricity costs several times as much as gas per kWh. Under the October to December 2026 price cap the ratio, the "spark gap", is about 3.3 (26.32p against 7.97p), and it exists largely because electricity carries policy costs that gas does not.
A heat pump only beats a gas boiler on running cost if it produces enough heat per unit of electricity to overcome that ratio. Using the October to December 2026 cap (26.32p per kWh for electricity, 7.97p for gas, Direct Debit, GB average), a heat pump needs a seasonal efficiency of roughly 2.8 to 3.0 to break even on unit rates against a modern condensing boiler. Under the April to June 2026 cap the bar was nearer 3.7 to 4.0. It moves every quarter.
That is the bar. It is set by energy policy, not by anyone installing anything.
Number two: where systems actually land
In the Electrification of Heat Demonstration Project, the 428 air source heat pumps in the performance analysis had a median seasonal performance factor of 2.78 (SPF H4, the whole-system measure), with the middle half between 2.55 and 3.05. The project installed 742 heat pumps across a wide range of housing types. Its median is more than 10% better than the 2.44 in the RHPP trial results published in 2017: genuine progress, and now roughly at the break-even bar on a standard tariff.
Put the two numbers together and the picture is uncomfortable but clear: a typical UK heat pump on a standard tariff is roughly cost-neutral with gas. Not because it was installed badly. Because of where the bar sits.
This is the part most coverage misses in both directions. Sceptical pieces treat a higher bill as proof the technology doesn't work. Enthusiastic pieces quote savings that assume a specialist heat pump tariff without saying so. Both are describing a real scenario and neither is describing a typical one.
Where installation quality actually enters
Take two systems in the same house, one reaching a seasonal efficiency of about 2.5 and one about 3.8 (illustrative values). The first uses roughly 50% more electricity for the same heat. With the break-even bar at about 2.8 to 3.0 under the current cap, one costs more than gas and the other costs less.
So the design decision doesn't create the running cost problem. It decides who the price ratio claims. A house that lands at 3.8 is cheaper to heat than it was on gas. The same house, same climate, same occupants, landing at 2.5 is substantially more expensive. Both outcomes are available in the same building.
That is why "my heat pump is expensive" and "my heat pump halved my bills" are both honest reports. They are not describing different technologies. They are describing different sides of a threshold.
The evidence on sizing
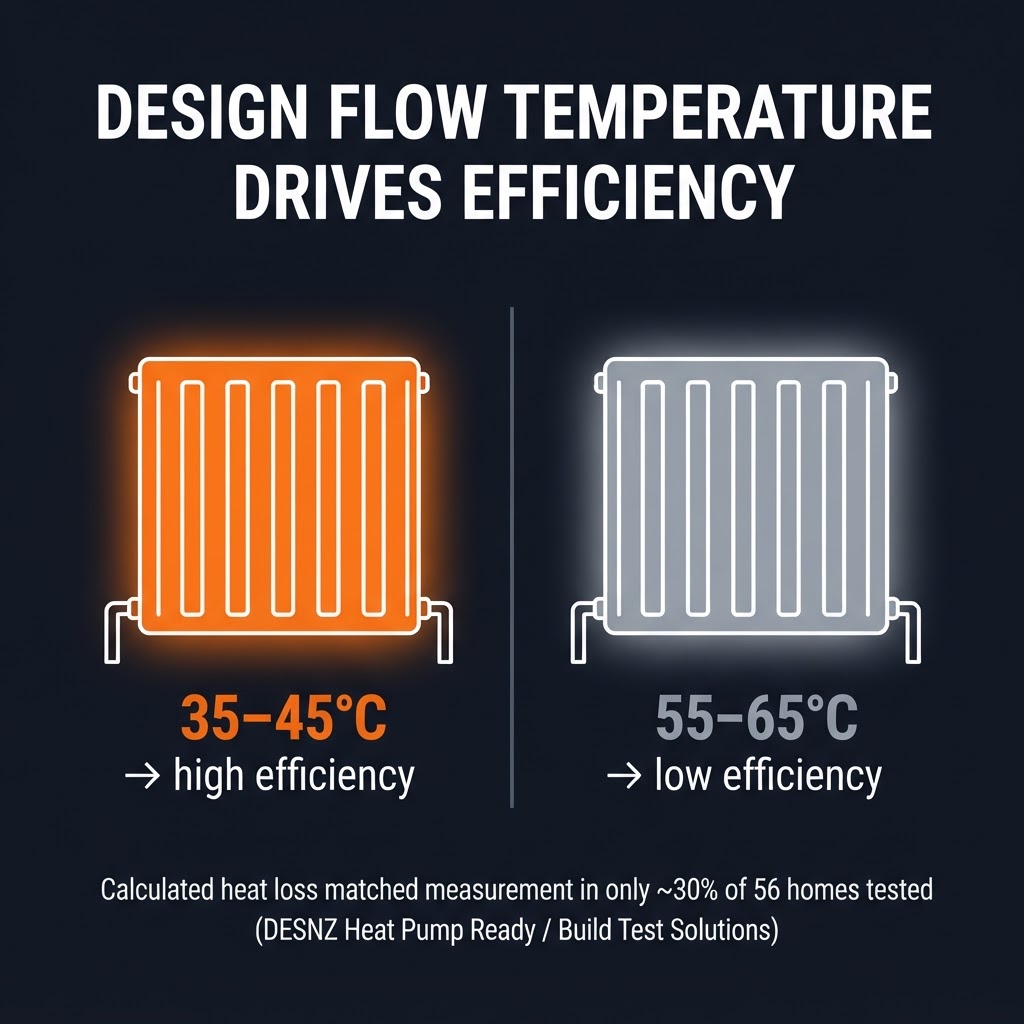
The single biggest predictor of seasonal efficiency is design flow temperature. Systems designed to run at 35–45°C achieve high efficiency; systems running at 55–65°C do not. Sizing decisions drive flow temperature, which is why they matter out of proportion to how routine they look.
Two pieces of evidence, both government-funded, both with limits worth stating.
The Electrification of Heat home surveys and install report. Feedback from project delivery partners identified an overall industry trend towards surveyors being overly cautious in design assumptions when calculating a property's heat demand, leading to oversizing. The same report notes that different understandings and interpretations of MCS standards, and how to demonstrate compliance with them, emerged through the project.
Worth reading that carefully. It is not a claim that installers are careless. It is a finding that the standards are interpreted differently by competent people, and that the direction of error is consistent — upward.
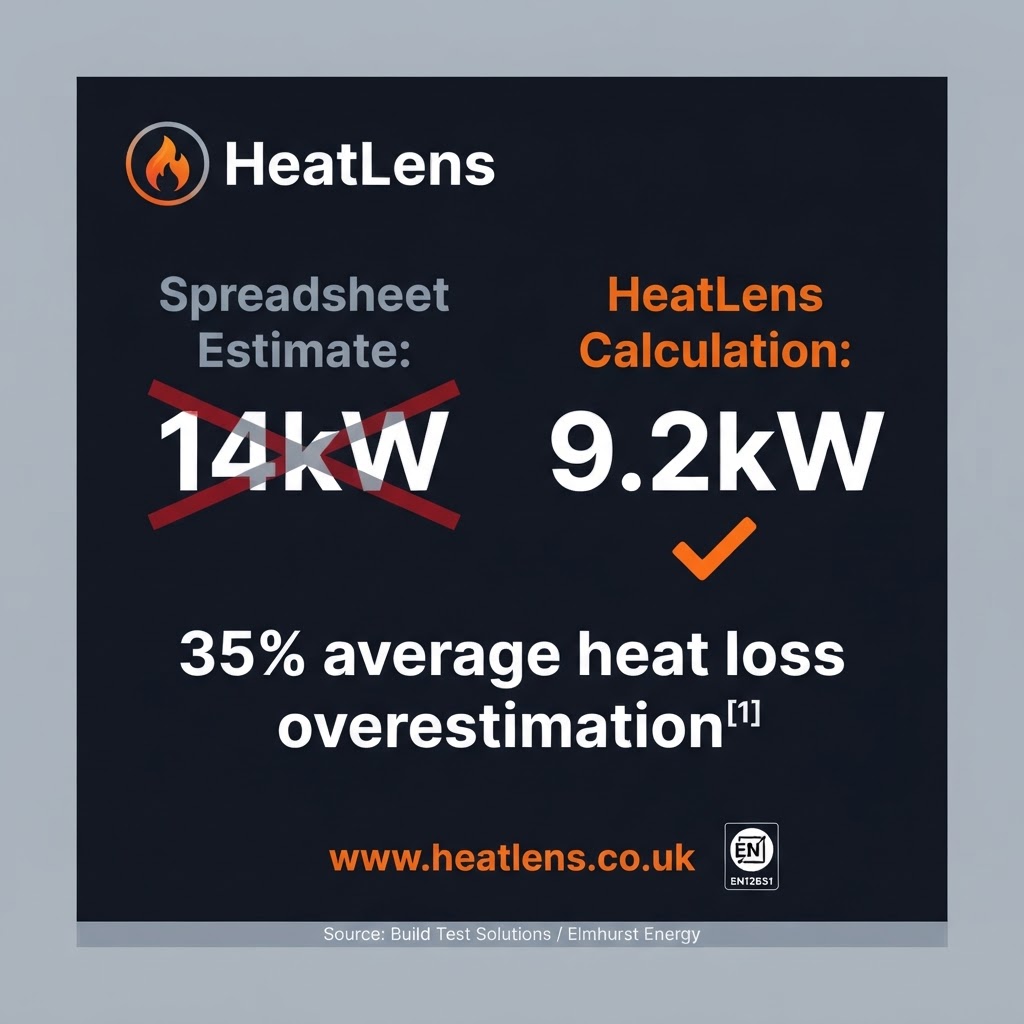
The measured heat loss work under DESNZ's Heat Pump Ready programme, carried out by Build Test Solutions, Veritherm and Elmhurst, compared calculated heat loss against physically measured heat loss in 56 homes. Calculated figures matched measurement in roughly 30% of cases, with the bias towards overestimation.
That sample is small and weighted towards detached and newer stock, so it cannot carry a national claim on its own. Treat it as a signal consistent with the EoH finding rather than as a settled number.
The mechanism that actually costs trust
There is a documented gap between average design SCOPs — the efficiency figure a customer is quoted before purchase — and average in-situ seasonal performance. It is real enough that the Heat Pump Association worked with the MCS heat pump technical working group to update MCS 031, the pre-sale performance calculation standard, in direct response to the EoH findings.
Consider what that gap does to a household. They are quoted a number. They plan around it. The system delivers materially less. Their bill arrives.
The damage here is not the bill. It is that they were given a figure that didn't happen. A homeowner who is told "this will cost about the same as gas, possibly a bit more on a standard tariff, and considerably less if you switch to a heat pump tariff" and then experiences exactly that is not an unhappy customer. A homeowner promised savings who gets a higher bill is an unhappy customer who tells everyone — and they are right to.
One thing the sizing argument gets wrong
An honest caveat that this industry does not make often enough.
Overestimating heat loss is not uniformly harmful. If an inflated calculation results in larger radiators, the system can run at a lower flow temperature and may achieve better seasonal efficiency than a tightly specified one. Oversized emitters are frequently a benefit.
The harm is narrower and specific: oversized heat pump units, which cycle rather than modulate at part load and lose efficiency doing it; inflated quotes that lose the customer before anything is installed; and specifying a property as needing more intervention than it does.
Anyone arguing that overestimation is simply bad has not looked closely enough, and will be corrected by someone who has.
What follows
Two things set whether a UK household saves money with a heat pump. One is the electricity-to-gas price ratio, which is a policy decision nobody in this industry controls. The other is whether the system is designed to clear the bar that ratio sets, which is entirely within the industry's control and is currently decided by a calculation that competent professionals perform differently from one another.
Only one of those is going to move this year.
The coverage that frustrates this sector is not fabricating its anecdotes. It is attributing them to the technology rather than to a price ratio and an installation. The rebuttal isn't to dispute the bills. It is to be able to say, with data rather than assertion, why two identical houses ended up on opposite sides of the line — and then to make landing on the right side the normal outcome rather than the fortunate one.
Sources and limitations
- Electrification of Heat Demonstration Project (Energy Systems Catapult, DESNZ-funded): 742 heat pumps installed. Home Surveys and Install Report for the oversizing finding. SPF figures: Heat Pump Performance Data Analysis Report (December 2024; read 11 October 2026), Table 1.2: median air source SPF H4 2.78 (interquartile range 2.55 to 3.05) and SPF H2 2.93, 428 systems, against RHPP SPF H4 2.44 (292 systems). The report itself notes results reflect the knowledge and experience of the specific surveyors and installers involved, that the three delivery contractors took different approaches affecting comparability, and that some findings are subjective.
- Measured heat loss study (Build Test Solutions, Veritherm, Elmhurst, under DESNZ Heat Pump Ready): 56 homes, weighted towards detached and newer properties. Directional evidence, not a national estimate.
- Spark gap and price data: Ofgem price cap, Direct Debit, GB average (April to June 2026 announcement; unit rates page, read 9 October 2026). Apr–Jun 2026: 24.67p electricity, 5.74p gas (ratio 4.3). Oct–Dec 2026: 26.32p and 7.97p (ratio 3.3). The cap changes quarterly, so check current rates before relying on any break-even figure here.
- MCS 031 was updated by MCS with the Heat Pump Association in response to the design-versus-in-situ gap identified by EoH.
Break-even efficiency figures depend on tariff, boiler efficiency, and the current cap. They are illustrative of the relationship, not a quotation for any particular home.
If you think any figure here is wrong, we would rather know. Corrections to info@heatlens.co.uk.