Worked example: 1960s semi-detached house, around 110 m². Both figures below come from the HeatLens design heat load engine (the CIBSE Domestic Heating Design Guide method, which is based on BS EN 12831-1). Workings follow.
Tape measure error, sitting room wall ±8 W From measuring the 16.9 m² wall to ±1.5% in each direction. Not knowing if the cavity is filled +379 W Same wall, same room: filled cavity against the "as built" default for its age band.
The problem with a precise survey
The UK heat pump design software market has converged on a common idea: make the survey faster by capturing the geometry automatically. Point a phone with a LiDAR sensor around a room and you get walls, windows, doors and ceiling heights in a single walk. That is useful, and it has taken a lot of drudgery out of site visits.
But look at what is left once the scan is done. The surveyor still has to say what each wall is made of, how much insulation is in the loft, what glazing is fitted, what the floor is, and how leaky the house is. Those inputs are typed or picked from a list, often under time pressure, and where there is no evidence to hand they fall back to a default based on the age of the house. Industry guidance says the same thing: the most common fabric error is getting the construction wrong, which can change the calculated fabric loss for an element by a factor of four or more, and the most common ventilation error is misjudging air change rates, which can double the ventilation loss.¹
A thorough room-by-room survey of a three or four bedroom house takes somewhere between one and four hours on site.¹ ² Our question is simple: of those hours, how many go on the inputs that decide the size of the heat pump and its radiators, and how many go on the inputs that barely move it?
The house
Our worked example is a 1960s semi-detached house in Cardiff: around 110 m² over two storeys plus a room in the roof, brick cavity walls, a solid ground floor, double glazing and a single storey rear projection. It is the same property we used in our write-up of how UK heat loss guidance diverges. The layout is reasoned from the EPC and room records rather than surveyed, so treat it as a realistic test case; it is not a design for that address.
With the reference inputs (filled cavity, 270 mm loft insulation, 50 mm in the roof room slopes, 12 mm air-gap double glazing, the DHDG default air permeability of 9.2 m³/(h·m²) and the Cardiff 99.6% design temperature of −3.1 °C) the engine gives a heat generator sizing load of 4.93 kW and a sum of room loads for emitter sizing of 5.60 kW.
Every fabric line in that chart is the product of three numbers: an area, a U-value and a temperature difference. The temperature difference is fixed by the standards. So the question for each element is which of the other two you are less sure of.
One wall, two kinds of error
Take the sitting room's external wall. It has 16.9 m² of brick cavity wall after the window is taken out, the room is heated to 21 °C and the design outdoor temperature is −3.1 °C.
| Sitting room wall | Filled cavity (reference) | Cavity "as built" default |
|---|---|---|
| Area A | 16.9 m² | 16.9 m² |
| U-value | 0.57 W/m²K (DHDG Table 2-28) | 1.50 W/m²K (RdSAP age band D) |
| + thermal bridging | 0.10 W/m²K | 0.10 W/m²K |
| ΔT = 21 − (−3.1) | 24.1 K | 24.1 K |
| A × U × ΔT | 273 W | 652 W |
| Now compare the two errors | |
|---|---|
| Measurement error, ±1.5% on length and height | ≈ ±3% area → ±8 W |
| Unknown cavity fill | +379 W (+139%) |
| Sitting room design load, filled → unfilled | 948 W → 1,327 W |
The fabric question is worth about 47 times the measurement question for this wall, and it adds 40% to the room's radiator requirement. The window next to it tells the same story: ±10% on its 5.0 m² area moves the loss by ±35 W, while the gap between a low-e argon unit (U 2.0) and an early 6 mm air-gap unit (U 3.1) is 133 W.
The tape measure and the LiDAR scanner are both working on the part of the sum that was already well constrained. The U-value is the part that can more than double the answer, and it gets a drop-down.
Every input, ranked by what it can do to the answer
We repeated that exercise for every input, one at a time, using the whole house. Each bar shows how far the design load moves across a plausible range for that input when it has not been confirmed on site. The ranges are deliberately ordinary: a filled or unfilled cavity, loft insulation anywhere from 50 mm to 300 mm, the spread of UK air permeability measurements, and so on. The full list is in the table under the chart.
kW
| Input | Range tested | Heat pump kW | Radiators kW |
|---|---|---|---|
| Cavity fill: filled or as built (fabric) | U 0.57 to 1.50 | 4.93 to 6.47 | 5.60 to 7.15 |
| Roof room slopes (fabric) | 100 mm to uninsulated | 4.83 to 5.64 | 5.50 to 6.32 |
| Loft insulation depth (fabric) | 300 mm to 50 mm | 4.89 to 5.56 | 5.57 to 6.24 |
| Air permeability (airtightness) | q50 5.3 to 15 | 4.66 to 5.33 | 5.07 to 6.41 |
| Cavity fill quality (fabric) | U 0.45 to 0.80 | 4.73 to 5.31 | 5.41 to 5.99 |
| Glazing specification (fabric) | U 2.0 to 3.1 | 4.56 to 5.07 | 5.23 to 5.74 |
| Room dimensions, from plan (geometry) | ±2.5% each way | 4.69 to 5.17 | 5.34 to 5.88 |
| Design temperature column (method) | A (99%) or B (99.6%) | 4.62 to 4.93 | 5.25 to 5.60 |
| Room dimensions, laser or LiDAR (geometry) | ±1.5% each way | 4.78 to 5.07 | 5.44 to 5.77 |
| Thermal bridging (method) | 0.10 or 0.15 W/m²K | 4.93 to 5.17 | 5.60 to 5.85 |
| Window areas (geometry) | ±10% | 4.82 to 5.03 | 5.50 to 5.71 |
| Ground floor insulation (fabric) | none or 50 mm | 4.76 to 4.93 | 5.44 to 5.60 |
| Timber infill panels (fabric) | U 0.45 to 1.08 | 4.79 to 4.93 | 5.47 to 5.60 |
| External doors (fabric) | U 1.8 to 3.0 | 4.83 to 4.93 | 5.51 to 5.60 |
Three things stand out.
- The single biggest lever is one yes-or-no question about the walls. An unconfirmed cavity fill, left at the "as built" default for a 1960s house, adds 1.5 kW to the heat pump and 1.5 kW across the radiators.
- The awkward bits of the roof matter. The room-in-roof slopes are only 20 m², but uninsulated they add as much as dropping the loft from 300 mm to 50 mm.
- Geometry still matters, within known limits. A floor plan that is 2.5% out in every dimension moves the answer by about ±0.24 kW, which is real. It is also something you can check without a site visit, by reconciling the plan against the floor area on the EPC.
Why not just use the defaults? Put the two biggest fabric unknowns at their year-of-build defaults (cavity as built, 100 mm loft) and leave everything else alone. The heat pump sizing load goes from 4.93 kW to 6.78 kW, 38% higher, and the radiator total from 5.60 kW to 7.46 kW. That can be the difference between a 5 kW and a 7 or 8 kW class heat pump, with every room's radiator sized up to match. Defaults exist so that a calculation can run; evidence is what makes it a design.
Where the survey time goes
Now put the ranking next to how a typical survey is spent. The time split below is our own estimate for a three hour survey of a house like this one, based on the tasks a room-by-room heat loss survey involves. Your own surveys will differ, and we would like to hear by how much. The uncertainty split comes from the simulation in the next section.
Share of survey time Share of uncertainty in the heat pump size
About three quarters of the heat loss survey time goes on the inputs that explain around 3% of the uncertainty in the answer.
On our estimate, the parts of the model that are easiest to measure get measured with great care, often for a second time when a floor plan already exists. The parts that dominate the answer get a glance into the loft and a best guess from the age of the house.
What happens when you move the effort
To test this properly we ran the engine 2,000 times for each of three survey approaches, letting each uncertain input vary across its range at random. This is a Monte Carlo simulation: instead of one answer, it gives the spread of answers that a survey of that quality could honestly support.
| Scenario | Geometry | Fabric | Air permeability |
|---|---|---|---|
| A. Measure every room | Laser or LiDAR, ±1.5% | Unverified: cavity fill 50/50, loft 50 to 300 mm, roof room 0 to 100 mm, glazing U 2.0 to 3.1 | Default, GB spread 8.6 ± 3.3 |
| B. Use the plan, evidence the fabric | Existing plan checked against EPC area, ±2.5% | Evidenced: fill confirmed, loft 250 to 300 mm photographed, glazing dated | Default, GB spread 8.6 ± 3.3 |
| C. As B, plus an airtightness test | As B | As B | Measured, ±0.5 |
A. Measure every room P10–P90 2.39 kW B. Plan + evidenced fabric P10–P90 0.85 kW C. B + airtightness test P10–P90 0.65 kW Dashed line: reference design load, 4.93 kW. Shaded band: middle 80% of 2,000 runs.
| Scenario | P10 | Median | P90 | P10 to P90 | Biggest driver of what is left |
|---|---|---|---|---|---|
| A. Measure every room | 4.78 | 6.03 | 7.17 | 2.39 kW | Cavity fill (66%), roof room (15%) |
| B. Plan + evidenced fabric | 4.47 | 4.89 | 5.32 | 0.85 kW | Geometry (52%), air leakage (44%) |
| C. B + airtightness test | 4.60 | 4.92 | 5.25 | 0.65 kW | Geometry (89%) |
Two findings matter here. The first is the headline: evidencing the fabric cuts the plausible range by nearly two thirds, while measuring rooms more precisely in scenario A would barely change it, because geometry explains only 3% of that spread.
The second is more subtle, and it is where LiDAR and careful measurement come back in. Once the fabric is known, geometry becomes the largest thing left. That is the right time to care about it. Precision on room sizes pays off after the big unknowns have been closed, and it is wasted before. It also tells you the order to work in: start from the plan you already have, spend the site visit on the evidence that moves the answer, and only then decide whether any room is worth measuring again.
Why a kilowatt matters
A heat load that is out by a kilowatt or two changes more than the badge on the outdoor unit. It flows through to the radiators, the flow temperature and the running cost.
| If the cavity was assumed filled but is actually empty | |
|---|---|
| Radiators sized for | 5.60 kW at 45 °C flow, 40 °C return |
| Mean water to room, ΔT₁ | 42.5 − 21 = 21.5 K |
| Actual room load total | 7.15 kW (×1.28) |
| Needed ΔT₂ = ΔT₁ × 1.28^(1/1.3) | 25.9 K |
| Flow temperature needed | ≈ 49.4 °C (+4.4 K) |
| In-use COP at 45 → 49.4 °C * | 2.94 → 2.69 |
| Electricity for the same heat | about 9% more, every year |
In the sitting room alone the gap is larger: 948 W of radiator against a 1,327 W need, which calls for a 51 °C flow. *Straight-line interpolation between the Electrification of Heat trial figures of COP 3.50 at 35 °C and 2.38 at 55 °C flow.⁵ Radiator output exponent 1.3.
| If the cavity was assumed empty but is actually filled | |
|---|---|
| Design on year-of-build defaults | 6.78 kW |
| Real design load | 4.93 kW |
| Typical load, for the modulation check | 2.32 kW |
| Result | ~38% oversized |
A larger unit costs more to buy, and on most days the house will ask for well under half its rated output. If that falls below the unit's minimum output it will cycle on and off, which hurts efficiency and wear. The radiators will be larger than they needed to be, which is the one error that works in the householder's favour.
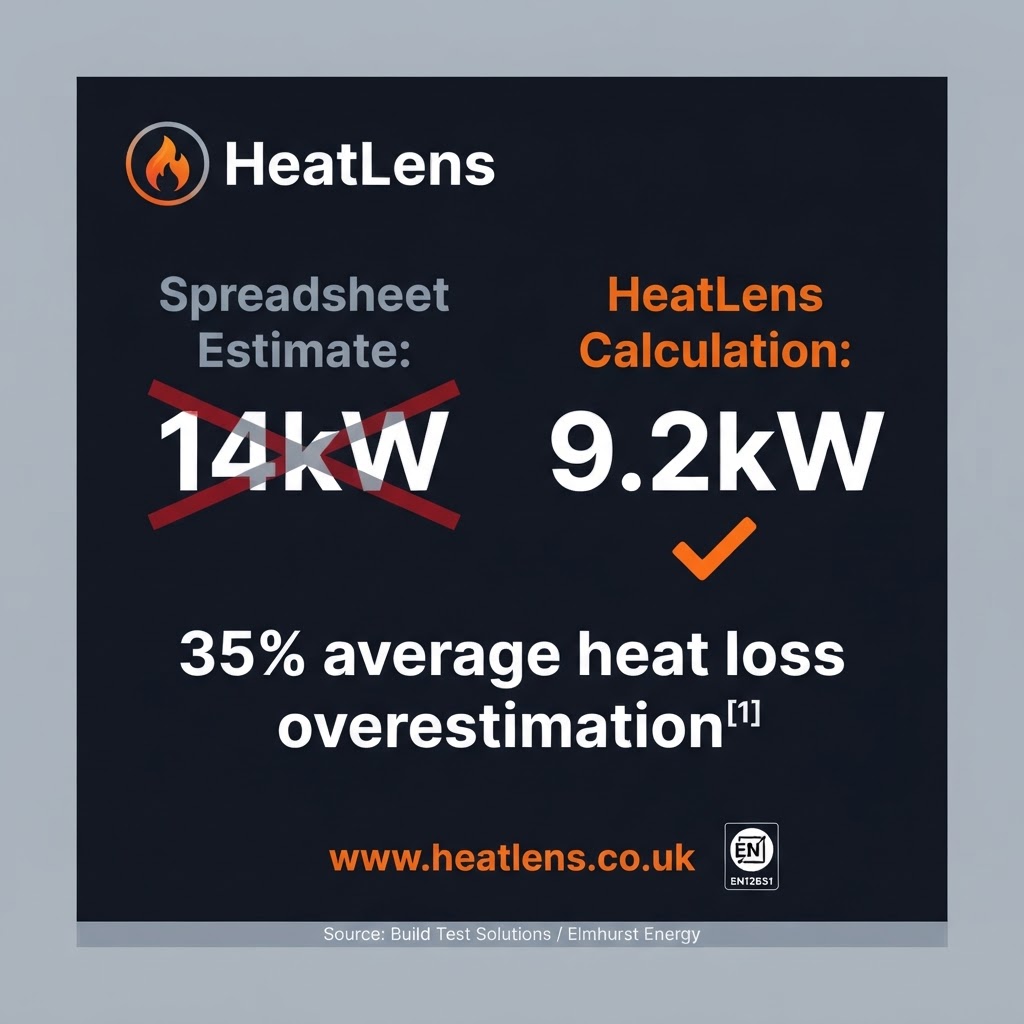
Either way, the uncertainty is paid for by someone: the installer in callbacks and reputation, or the householder in capital cost and bills. Measured performance data backs this up. A trial of 56 UK homes found an average absolute difference of 35% between measured and calculated heat loss,³ and in-use heat pump efficiency across hundreds of monitored systems sits well below what their specifications suggest.⁵
How HeatLens approaches the survey
HeatLens is built around the idea that the effort should follow the uncertainty. In practice that means four things.
- Start from the documents that already exist. Most homes that change hands have an estate agent floor plan and an EPC. HeatLens reads the plan with AI, including the building outline, so each room's external wall run gives its wall, window and door areas. It then reconciles the rooms against the EPC floor area, which is how the ±2.5% geometry in scenario B is checked without a site visit. The extracted plan is a proposal for the surveyor to review, not a finished survey.
- Label every value by where it came from. Each input carries a source: measured, calculated, standard, from EPC or assumed. The envelope and fabric panels show what each element contributes in watts, so an assumed U-value on a large wall is impossible to miss.
- Point at the two or three things worth checking next. The project status line names the few missing pieces of evidence that would change the answer most, and takes you straight to them. For this house that list starts with the cavity fill and the roof room.
- Assume where the standards allow, never silently. Where the guidance gives a defensible default, HeatLens uses it and says so on the report. The calculation is held at "indicative" until the assumptions that matter have been replaced with evidence.
What that means on site
For a house like this one, we would suggest the survey time goes on:
- Cavity walls: look for a drill pattern in the mortar, ask for a CIGA guarantee or installer paperwork, and use a borescope if in doubt.
- Loft and room in roof: photograph the insulation depth with a ruler in shot; check the slopes and stud walls of any roof room, which are often the least insulated surfaces in the house.
- Glazing: read the spacer bar and any date stamp, or ask for the FENSA certificate, to set a real specification instead of a guess.
- Air leakage: an airtightness test where the budget allows; at minimum, note open flues, chimneys, vents and obvious gaps.
- Geometry: check the plan against what you see, and re-measure only rooms where it looks wrong.
Who benefits
Homeowners
- A heat pump sized to the house, with radiators that let it run at a low flow temperature.
- A clear list of the documents that help, such as an insulation guarantee, a loft photo or a window certificate, before anyone visits.
- A report that shows which figures are measured and which are assumed, so quotes can be compared fairly.
Installers
- Geometry that can be done before arrival, which may mean a shorter site visit.
- Time on site spent on the checks that change the design.
- A design that can be defended: every value traced to its source, which may mean fewer callbacks from cold rooms or cycling units.
The bottom line
Geometry is the part of a heat loss calculation that we can know with the most confidence, and it is usually known before the surveyor arrives. The inputs that decide whether a 1960s semi needs a 5 kW or an 8 kW heat pump are the ones about what is inside the walls, above the ceilings and around the windows. A good survey should spend its time accordingly.
LiDAR made measuring rooms quicker. The next step is to treat room measurement as the starting point of a survey, and to give the rest of the visit to the evidence that sets the size of the system.
Try it on your own house or project. Start a project in HeatLens from your floor plan and EPC and see which inputs matter most.
Method and sources
All heat loss figures come from the HeatLens design heat load engine (engine version 0.1.0) run on an anonymised 1960s semi-detached test case whose geometry is reasoned from its EPC and room records and has not been surveyed. Method: CIBSE Domestic Heating Design Guide 2026, based on BS EN 12831-1:2017; Cardiff, column B, −3.1 °C; thermal bridging 0.10 W/m²K; DHDG Table 2-11 air permeability. Each one-at-a-time case changes one input and keeps the rest at reference. Monte Carlo: 2,000 runs per scenario, uniform or normal distributions as described; variance shares are squared correlations with the result and do not sum exactly to 100%. The survey time split is a HeatLens estimate and has not been measured. Designs must be checked and surveyed by a qualified MCS installer.
- Spruce, Heat loss surveys: the complete engineer's guide (survey time, common fabric and ventilation errors).
- Reonic, Heat loss survey 2026: the installer's pro guide (two to four hours on site) and LiDAR room scanning (what a scan captures; wall types still confirmed by the surveyor).
- Build Test Solutions, Veritherm and Elmhurst Energy trial of 56 homes: 35% average absolute difference between measured and calculated heat loss.
- Roberts, Li, Allinson and Lomas (2025), Baseline airtightness of the GB housing stock, DESNZ: mean 8.6 ± 3.3 m³/(h·m²) at 50 Pa.
- Energy Systems Catapult (2024), Electrification of Heat: heat pump performance data analysis (COP 3.50 at 35 °C flow, 2.38 at 55 °C).
- DESNZ, English Housing Survey 2024 to 2025: home insulation fact sheet (over 2.7 million households with less than 100 mm of loft insulation).
If you think any figure here is wrong, we would rather know. Corrections to info@heatlens.co.uk.