One house, a two-fold range
When I set out to replace the gas boiler in my own home, I received 10 heat pump quotes. The recommended sizes ranged from 5 kW to 10 kW, with a median of 8.5 kW. Same house, same climate, same occupants. We ultimately had a 7 kW system installed.
I still don't know exactly why each figure came out where it did. Most installers use their own in-house design tools, and the calculations behind the number are rarely shown to the householder. Some of the spread came from different assumptions about the building fabric. Some came from flow temperature, because a few installers planned to keep more of the existing radiators and run the system hotter, which pushes the design towards a bigger unit.
The cause of each quote matters less than the spread itself. A two-fold range for one dwelling tells you that the inputs, and the choices made about them, dominate the answer. The physics of steady-state heat loss is not in dispute. What is in dispute is what goes into it.
This is a problem I first met more than a decade ago, in a different context, and it shaped how HeatLens was built.
Where the idea comes from
My PhD at NUI Galway (completed 2013) focused on calibrating detailed building energy simulation models, EnergyPlus in particular, against measured data [1, 2]. Any detailed model carries hundreds of inputs, and for an existing building most of them are uncertain: construction U-values, infiltration, internal gains, schedules, plant efficiencies.
A central part of that work was treating those inputs as ranges rather than single values. Propagating input uncertainty through the model gives a band around each output instead of a single line. That band matters when you evaluate energy conservation measures. A retrofit that saves 20% in a deterministic run might save anywhere from 5% to 30% once the uncertainty in the baseline is accounted for, and that changes the investment case and the risk attached to it.
The companion technique is sensitivity analysis: working out which inputs drive most of the variance in the output [3]. In almost every building model, a small number of parameters explain most of the uncertainty. The rest barely register. That finding shaped the calibration method. Spend effort pinning down the few parameters that matter, and accept looser estimates for the rest.
At the time I saw this mainly as a tool for evaluating retrofit measures and calibrating models. I did not see how directly it would apply to heat pump design.
Why heat loss inputs are uncertain
A design heat loss calculation to BS EN 12831-1 or the MCS method is deterministic. It returns one number. Behind that number sit three kinds of uncertainty that the single figure hides.
Fabric that nobody has seen. Whether a cavity was filled, how much loft insulation is really there, what the floor is built from, whether a room in the roof was ever insulated. On a retrofit these are often assumed from the property age, an EPC or a quick look, and age-band defaults are conservative by design.
Air movement that nobody has measured. Few homes have an airtightness test. Ventilation heat loss is therefore usually set from a default or a judgement.
Method choices that are legitimately open. Designers can choose between design temperature columns, thermal bridging allowances, and whether to size the heat pump on the sum of room loads or a whole-dwelling figure. In Where UK heat loss guidance diverges, HeatLens ran a 1960s semi-detached house of around 110 m² in Cardiff through these conventions with identical inputs [4]. Single convention choices moved the heat pump sizing load from 4.62 kW to 5.17 kW against a reference of 4.93 kW. Sizing the heat pump on the sum of room loads (5.60 kW) overstated it by about 14%. Carrying SAP conventions into the design calculation pushed it to around 6 kW. Across the main conventions the spread was about 29%, before any fabric or airtightness uncertainty was added.
Geometry, by contrast, is the part most surveys spend the most time on, and it is usually the least uncertain.
Not all inputs matter equally
To test this on a real design problem, we ran a sensitivity analysis on the same 1960s semi using the HeatLens calculation engine [5]. First, each input was moved between a plausible low and high value while everything else was held fixed. This is the simplest form of sensitivity analysis, often shown as a tornado chart.
kW
Whether the cavity wall is filled moves the sizing load by about 1.5 kW. Laser measurement error of ±1.5% moves it by about 0.3 kW. Yet a typical survey spends most of its heat loss time measuring rooms, and comparatively little establishing what the walls are made of. If the cavity is left "as built" and the loft set to an age-band default, the sizing load rises from 4.93 kW to 6.78 kW, about 38% higher, without a single measurement being wrong.
We estimate that a three hour survey of a house like this spends about 105 minutes on heat loss inputs, and about three quarters of that on measuring rooms. That split is a HeatLens estimate, not a measurement, and we would like to hear how far real surveys differ [5]. One-at-a-time tests also ignore interactions, so we then ran a Monte Carlo analysis: 2,000 runs per survey strategy, sampling every uncertain input at once. The question was simple. Where should the survey time go?
A. Measure every room P10–P90 2.39 kW B. Plan + evidenced fabric P10–P90 0.85 kW C. B + airtightness test P10–P90 0.65 kW Dashed line: reference design load, 4.93 kW. Shaded band: middle 80% of 2,000 runs.
Under strategy A, where every room is measured carefully but the fabric is assumed, cavity wall status explained about 66% of the variance in the result and the room in the roof about 15%. Geometry explained about 3%. Moving effort from the tape measure to the fabric evidence (strategy B) cut the likely range from 2.4 kW to 0.85 kW. Adding an airtightness test (strategy C) narrowed it slightly further.
This is the same pattern I saw in calibrating detailed energy models a decade ago. A few parameters carry most of the uncertainty. Finding them first is what makes the rest of the effort worthwhile.
The cost of getting it wrong, in both directions
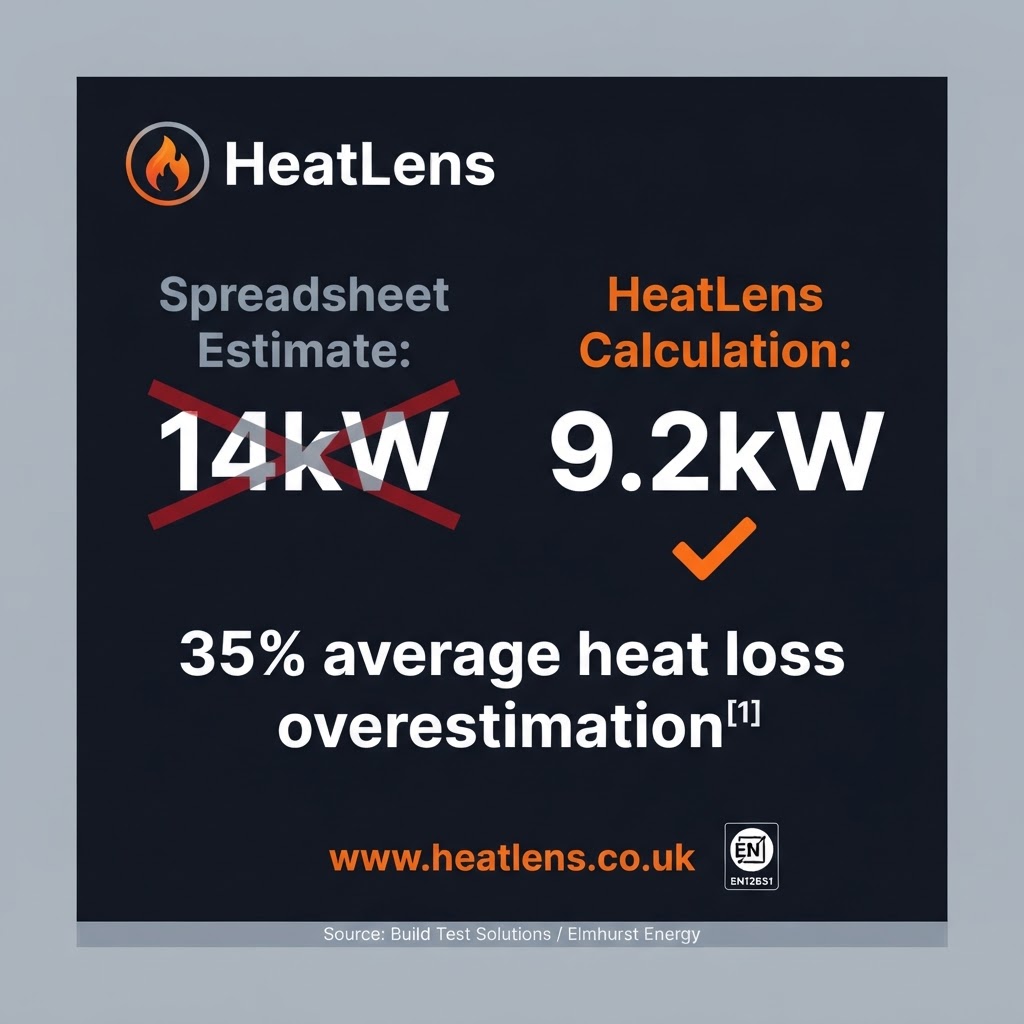
The usual concern is oversizing, and the field evidence supports it. In the government-funded Electrification of Heat trial, retrofit air source heat pumps averaged a seasonal performance of 2.81 across 428 systems, against 3.86 for 169 well set-up systems on HeatPumpMonitor.org. Rosenow, Lea and Boni name overestimated heat loss, alongside high flow temperatures and poor control settings, as causes of the gap [6]. Measured-versus-calculated studies point the same way. A comparison of 56 homes by Build Test Solutions, Elmhurst and Veritherm found an average absolute difference of 35% between calculated and measured heat loss, with 59% of homes overestimated and 13% underestimated [7].
An oversized heat pump costs more to buy, may need a larger electrical supply, and spends more of the season cycling at low load where many units run less efficiently. Conservative defaults stacked on top of each other are one of the main ways it happens.
Undersizing is less common but more visible to the householder. If the heat loss is underestimated, the emitters are too small for the design flow temperature, and the only fix on a cold day is to run hotter. In the same worked example, emitters sized for 5.60 kW at 45 °C against a true load of 7.15 kW would need a flow temperature of about 49 °C, which lowers the design-point COP from about 2.9 to 2.7 and uses roughly 9% more electricity [5]. In a worse case the house simply does not reach temperature.
Both errors come from the same root. A single deterministic figure is presented as if it were known precisely, when its uncertainty is dominated by two or three inputs that nobody checked.
Measure what matters most
HeatLens is built on one principle drawn directly from that research: spend your measurement effort in proportion to how much each input affects the answer.
In practice that means three things.
Start from the evidence that already exists. EPCs, floor plans, home reports and site photos already contain most of the geometry and much of the fabric description. HeatLens uses AI to read those documents and build a room-by-room model before anyone visits. Every value is tagged with its source and a confidence level, and nothing reaches the calculation until a designer has accepted or corrected it.
Flag the inputs that carry the risk. Rather than presenting every assumption with equal weight, the interface highlights the few inputs where an assumption, rather than evidence, is doing the work, such as an unconfirmed cavity fill or a defaulted airtightness value. The site visit can then start with a short list of the things worth checking.
Show the working. The calculation follows BS EN 12831-1 and MCS conventions, and each room carries a visible calculation trace. A householder, an installer or a researcher can see which assumptions produced the number and challenge the ones that matter. That transparency was missing from every one of the quotes on my own house.
We are also exploring how to report sizing as a range, with the inputs driving that range identified, as a natural next step. That is the direct descendant of the uncertainty bands I was drawing around retrofit savings in 2013.
What designers, installers and researchers can do now
For designers and installers. Before the survey, list the three inputs you are least sure of and plan the visit around confirming them. A borescope check on a cavity, a look into the loft and the room in the roof, and a view of the floor construction are usually worth more than an extra hour with the laser. Where an input cannot be confirmed, record it as an assumption on the report so the client can see it.
For researchers. Much of the building-stock modelling that informs heat pump policy inherits calculated heat loss from EPC-derived inputs. Treating those inputs as distributions, and reporting which ones dominate, would make it much clearer where better data would change the conclusions. HeatLens has offered free research access and would welcome collaboration on validating design-stage heat loss against measured performance.
For everyone. Ask to see the assumptions behind the number. A heat loss figure without its inputs cannot be checked, and one without a sense of its uncertainty cannot be trusted to the nearest kilowatt.
A follow-up post will look at a related trade-off that came up on my own house: how to balance flow temperature, emitter upgrades and the cost of keeping existing radiators.
Try it on your own house or project. Start a project in HeatLens from your floor plan and EPC and see which inputs matter most.
References
- Coakley, D. (2013). PhD thesis on the calibration of detailed building energy simulation models using an analytical optimisation approach. National University of Ireland, Galway.
- Coakley, D., Raftery, P. and Keane, M. (2014). A review of methods to match building energy simulation models to measured data. Renewable and Sustainable Energy Reviews, 37, 123–141.
- Saltelli, A. et al. (2008). Global Sensitivity Analysis: The Primer. Wiley.
- HeatLens (2026). Where UK heat loss guidance diverges: EN 12831, MCS and SAP 10.3. HeatLens blog, 19 September 2026.
- HeatLens (2026). Measure what matters: where a heat pump survey should spend its time. HeatLens blog, 24 September 2026. Sensitivity and Monte Carlo results from the HeatLens calculation engine, version 0.1.0; flow temperature and COP figures use Energy Systems Catapult (2024) Electrification of Heat performance data.
- Rosenow, J., Lea, R. and Boni, M. Bridging the efficiency divide: heat pump performance in the Electrification of Heat trial and on HeatPumpMonitor.org.
- Build Test Solutions, Veritherm and Elmhurst Energy trial of 56 homes: 35% average absolute difference between measured and calculated heat loss.
- BSI (2017). BS EN 12831-1:2017 Energy performance of buildings. Method for calculation of the design heat load. Part 1: Space heating load.
- MCS. MIS 3005-D: The Heat Pump Design Standard. Issue 3.0.
Figures come from an anonymised test case whose geometry is reasoned from its EPC and room records, not surveyed. Designs must be checked and surveyed by a qualified MCS installer. If you think any figure here is wrong, we would rather know: info@heatlens.co.uk.