A heat pump that underperforms rarely announces itself. The house is warm and the unit runs. The first sign is a bill that is higher than the customer was told to expect, months after the installer has left. Nobody looks at the system again unless someone complains, so the heat pump performance gap stays invisible until it turns into a callback.
EoH trial, 428 air source heat pumps 2.78 Median SPF H4. The middle half sat between 2.55 and 3.05. Bristol audits, 92 systems 92 of 92 Every audit found at least one design, installation or commissioning fault. Bristol audits, Nesta's 39 36 Systems with weather compensation switched off, so running a fixed flow temperature.
How wide is the heat pump performance gap?
The government's Electrification of Heat (EoH) demonstration monitored 428 air source heat pumps for a year each. The median seasonal performance factor at the H4 boundary was 2.78. The middle half of systems sat between 2.55 and 3.05, and the spread ran from below 2 to above 4. For 91.9% of homes, measured SPF was below the design SCOP, with the median 17.9% below. The report found little correlation between the two.
HeatpumpMonitor.org tells a different story. It is an open, self-selected group of systems, many designed by specialists. Across 594 systems, the mean SPF H4 was 3.86 (Rosenow, Lea and Boni, 2026, as summarised by CIBSE Journal). The strongest single predictor of performance was the gap between flow temperature and outdoor temperature. Of 165 Vaillant Arotherm systems the authors inspected, 55% had weather compensation set too high.
The heat pumps in these studies are broadly the same technology. The difference of about one SPF point between a typical system and a well-run one comes mostly from flow temperature and controls.
What Bristol's 92 heat pump audits found
Nesta and Bristol City Council published their findings on 5 October 2026. Ninety-two technical audits of social housing heat pumps found at least one fault in every system. Thirty-nine audits were Nesta's own. The other 53 were earlier audits by the council, MCS and the University of Bristol.
In Nesta's 39 audits:
- 36 systems had weather compensation switched off, so they ran at a fixed flow temperature.
- 20 had inadequate external pipe lagging.
- 24 had no efficiency data available at all.
The 15 systems that did have data averaged an SPF just under 2.8, ranging from 1.9 to 3.3.
The fixes were cheap. Thirty repair visits averaged about £204 excluding VAT, 94% of it labour. They covered lagging, lower flow temperatures, weather compensation switched on, and commissioning changes.
But Nesta could not confirm the efficiency gain afterwards, because there was no post-repair data. That gap is the case for monitoring.
Three kinds of heat pump fault, three kinds of fix
| Kind of fault | Examples from Bristol | Visible in monitoring data? | Usual fix |
|---|---|---|---|
| Controls and settings | Weather compensation off, flow temperature too high, heating on in summer, hot water timing | Yes, from heat, electricity and temperatures over time | A settings change by the installer, made remotely where the homeowner has given access |
| Installation | Pipe lagging, condensate, unit not level | Partly: it shows as lower efficiency, not as the cause | A site visit |
| Design and fabric | Oversizing, oversized cylinders, undersized emitters, no heat loss calculation | Partly: measured heat loss against the design over a season | A design review. It cannot be tuned away. |
The first row is the most common in Bristol and the cheapest to fix. With simple monitoring in place, these faults can be found remotely and often fixed remotely, then checked again afterwards without anyone going back to site. In Bristol, none of that was possible: most systems had no efficiency data, so the faults waited for an audit.
Tuning a Vaillant weather compensation curve remotely
Weather compensation sets the flow temperature from the outdoor temperature. The aim is the lowest curve that keeps the home at its setpoint, with the occupants comfortable.
A curve rarely lands right at commissioning. In the first weeks, the fabric warms through. The household also gets used to a system that runs low and steady rather than in bursts. Tuning is a short series of small changes, and each one needs a few days of data to judge.
On a Vaillant aroTHERM plus with a sensoCOMFORT controller and its outdoor sensor, the loop looks like this:
- Start from the design. At commissioning, the installer sets the heating curve so the flow temperature meets the design flow temperature at the design outdoor temperature. They also set the outdoor switch-off temperature. And they decide whether the room sensor should trim the flow temperature, which Vaillant calls room temperature modulation.
- Connect the data. With the homeowner's consent, the installer gets access in one of two ways. The homeowner can invite them as a user on the myVAILLANT app. Or the installer can use Vaillant's myVAILLANT Pro service to see fault codes and the controls. HeatLens reads the same data. It takes it by file export today, and a direct connection is planned through Vaillant's official developer programme.
- Watch a week of weather. HeatLens compares the room temperature with the setpoint, day by day, against the outdoor temperature. It also plots heat delivered against how cold it was (the heating signature).
- Read the pattern, then change one thing. See the table below.
- Apply the change. The installer makes the change through the access the homeowner has given: the shared app or myVAILLANT Pro. Otherwise they talk it through with the homeowner by phone. HeatLens suggests changes but never writes a setting.
- Check it worked. The next week's data shows whether rooms held their setpoint and what happened to efficiency. That is the post-repair evidence Bristol did not have.
| What the data shows | Likely cause | Change to try |
|---|---|---|
| Rooms below setpoint on cold days, fine on mild days | Curve too shallow at the cold end | Raise the curve one small step |
| Rooms above setpoint on mild days, fine on cold days | Curve too high at the mild end | Lower the curve, or the minimum flow temperature |
| Rooms above setpoint in all weather | Curve too high overall | Lower the curve one small step |
| Heating running on days above the home's balance point | Outdoor switch-off set too high | Lower the switch-off temperature |
| Rooms at setpoint but efficiency falling, or frequent starts | Zones, valves or room modulation fighting the curve | Review with the household: open valves, check zones |
Make one change at a time and wait a few days, because the house responds slowly. Keep a note of each setting and the date.
Most homes settle within the first heating season. Monitoring turns tuning from something driven by callbacks into something planned. It also keeps the checks going after the first cold spell.
A worked example: one home's Performance tab
HeatLens has been testing a Performance tab on the founder's own home. It is a detached house with a Vaillant aroTHERM plus, commissioned in February 2026. The MCS certificate declares a SCOP of 3.91 at 45 °C flow. The home also has solar PV, a battery, an EV charger and an Octopus smart meter.
The data covers 5 February to 14 August 2026 and was uploaded as files from three places:
- the myVAILLANT export;
- the Octopus half-hourly download;
- the mySigen station export.
The heat pump's heat and electricity figures are its own estimates, not a heat meter.
Space heating is compared for the weather that actually happened (heating degree days, base 15.5 °C). Hot water is compared day for day. Heat pump figures: manufacturer-reported. Click a figure to see how it is calculated. Heating carries on until the outdoor temperature averages about 18.9 °C; the design assumes 15.5 °C. A warmer home, or heating left on in mild weather, raises this. Hot water: 1,275 kWh delivered over 191 days against 2,285 kWh in the design (-44%).Design against actual
Over 191 days, space heating ran at 4.29 units of heat per unit of electricity, by the heat pump's own figures. Hot water ran at 3.41. Click any figure above to open its working: the days counted, the heat and electricity on those days, and where each figure came from.
This is not the same boundary as SPF H4. It uses manufacturer-reported figures and covers space heating only, so it cannot be ranked directly against EoH or HeatpumpMonitor.org. A heat meter would be needed to place this system on the same scale.
| Month | Days | Space heat (kWh) | Hot water (kWh) | Space heating SPF | Hot water COP | Mean outdoor (°C) |
|---|---|---|---|---|---|---|
| Feb (from 5th) | 24 | 2,286 | 139 | 3.74 | 3.08 | 5.9 |
| Mar | 31 | 2,334 | 219 | 4.25 | 3.19 | 8.2 |
| Apr | 30 | 1,865 | 216 | 4.55 | 3.32 | 9.9 |
| May | 31 | 1,295 | 225 | 4.77 | 3.50 | 13.3 |
| Jun | 30 | 640 | 183 | 4.82 | 3.59 | 16.5 |
| Jul | 31 | 295 | 194 | 4.77 | 3.65 | 17.7 |
| Aug (to 14th) | 14 | 113 | 100 | 4.91 | 3.71 | 17.8 |
| Total | 191 | 8,829 | 1,275 | 4.29 | 3.41 |
Design or controls? The heating signature
Space heating used 44% more than the design expects for the weather. On its own, that looks like a design problem. The heating signature says otherwise.
Plotting each day's heat against how cold it was gives a measured heat loss of 292 W/K (r² 0.88 over 98 days). That is 7% below the design's 315 W/K. The fabric is close to what was designed.
The extra heat comes from how the home is run. Someone is at home around the clock, and most rooms are held at a steady 21 °C on weather compensation alone. Heating carried on until the outdoor temperature averaged about 18.9 °C. The design's degree-day basis assumes 15.5 °C, which suits a home heated for less of the day.
What the checks flagged
 Source: HeatLens Performance tab, founder's home, 12 October 2026.
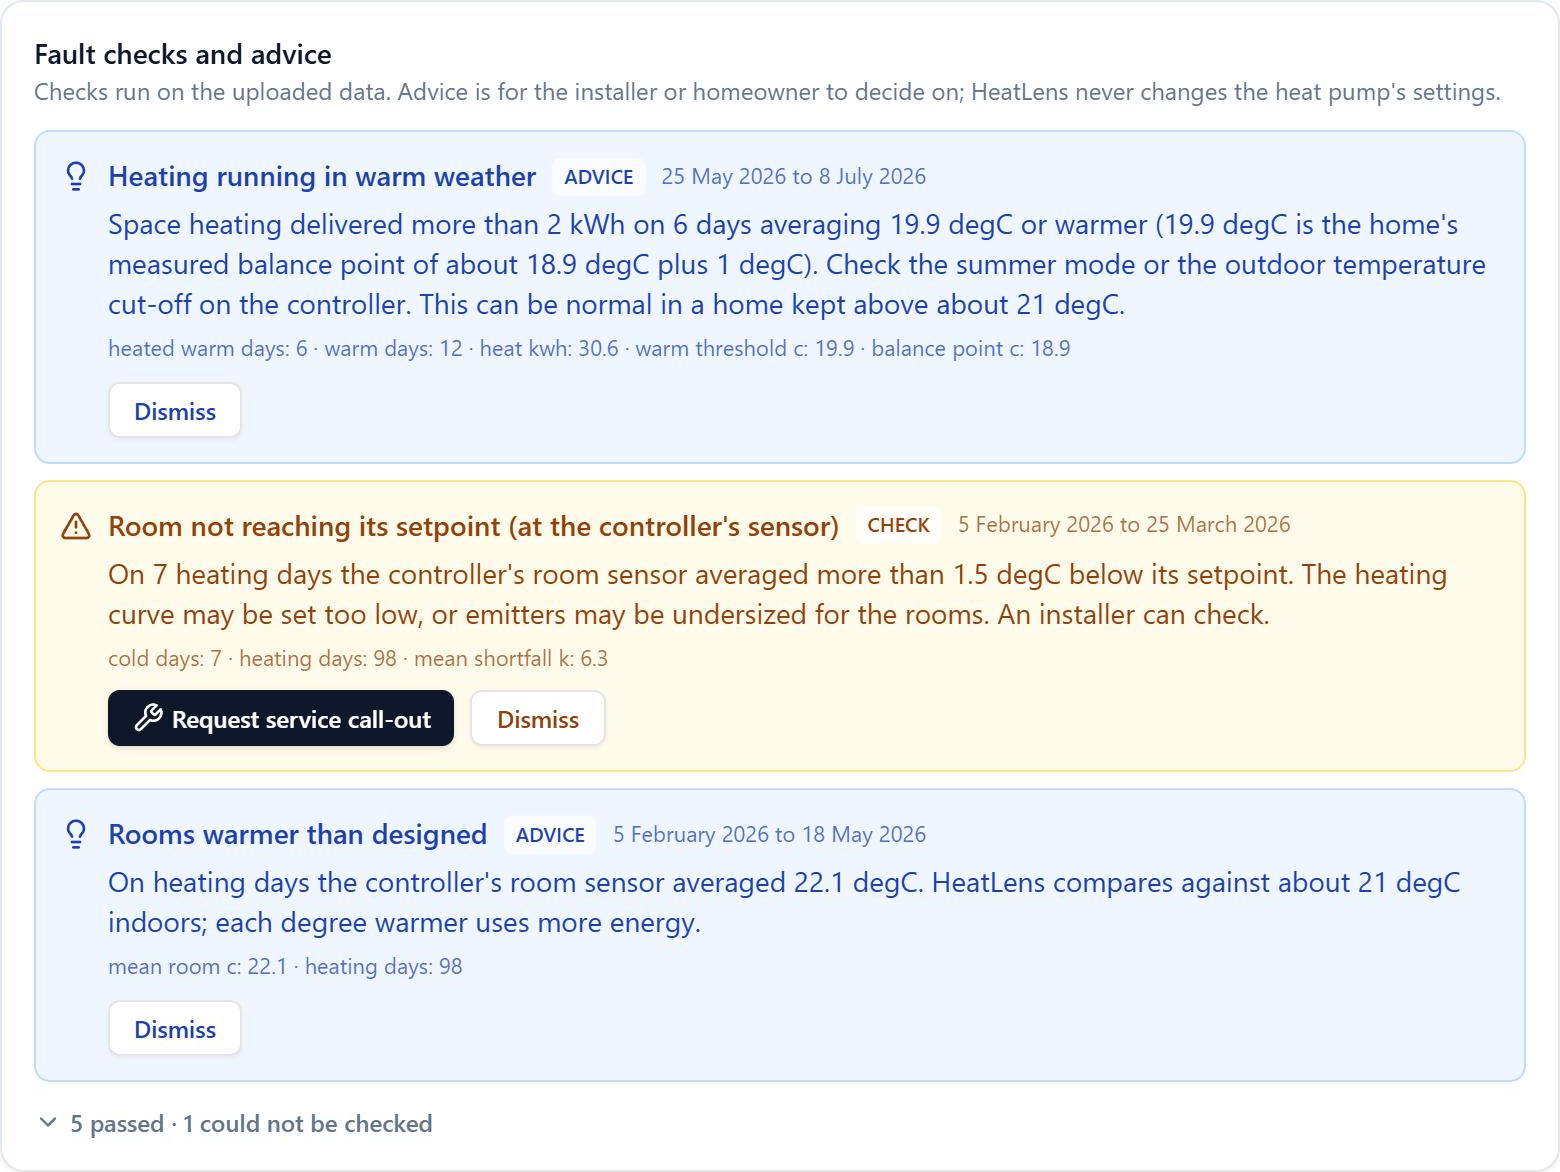
The tab ran its fault checks and flagged three things:
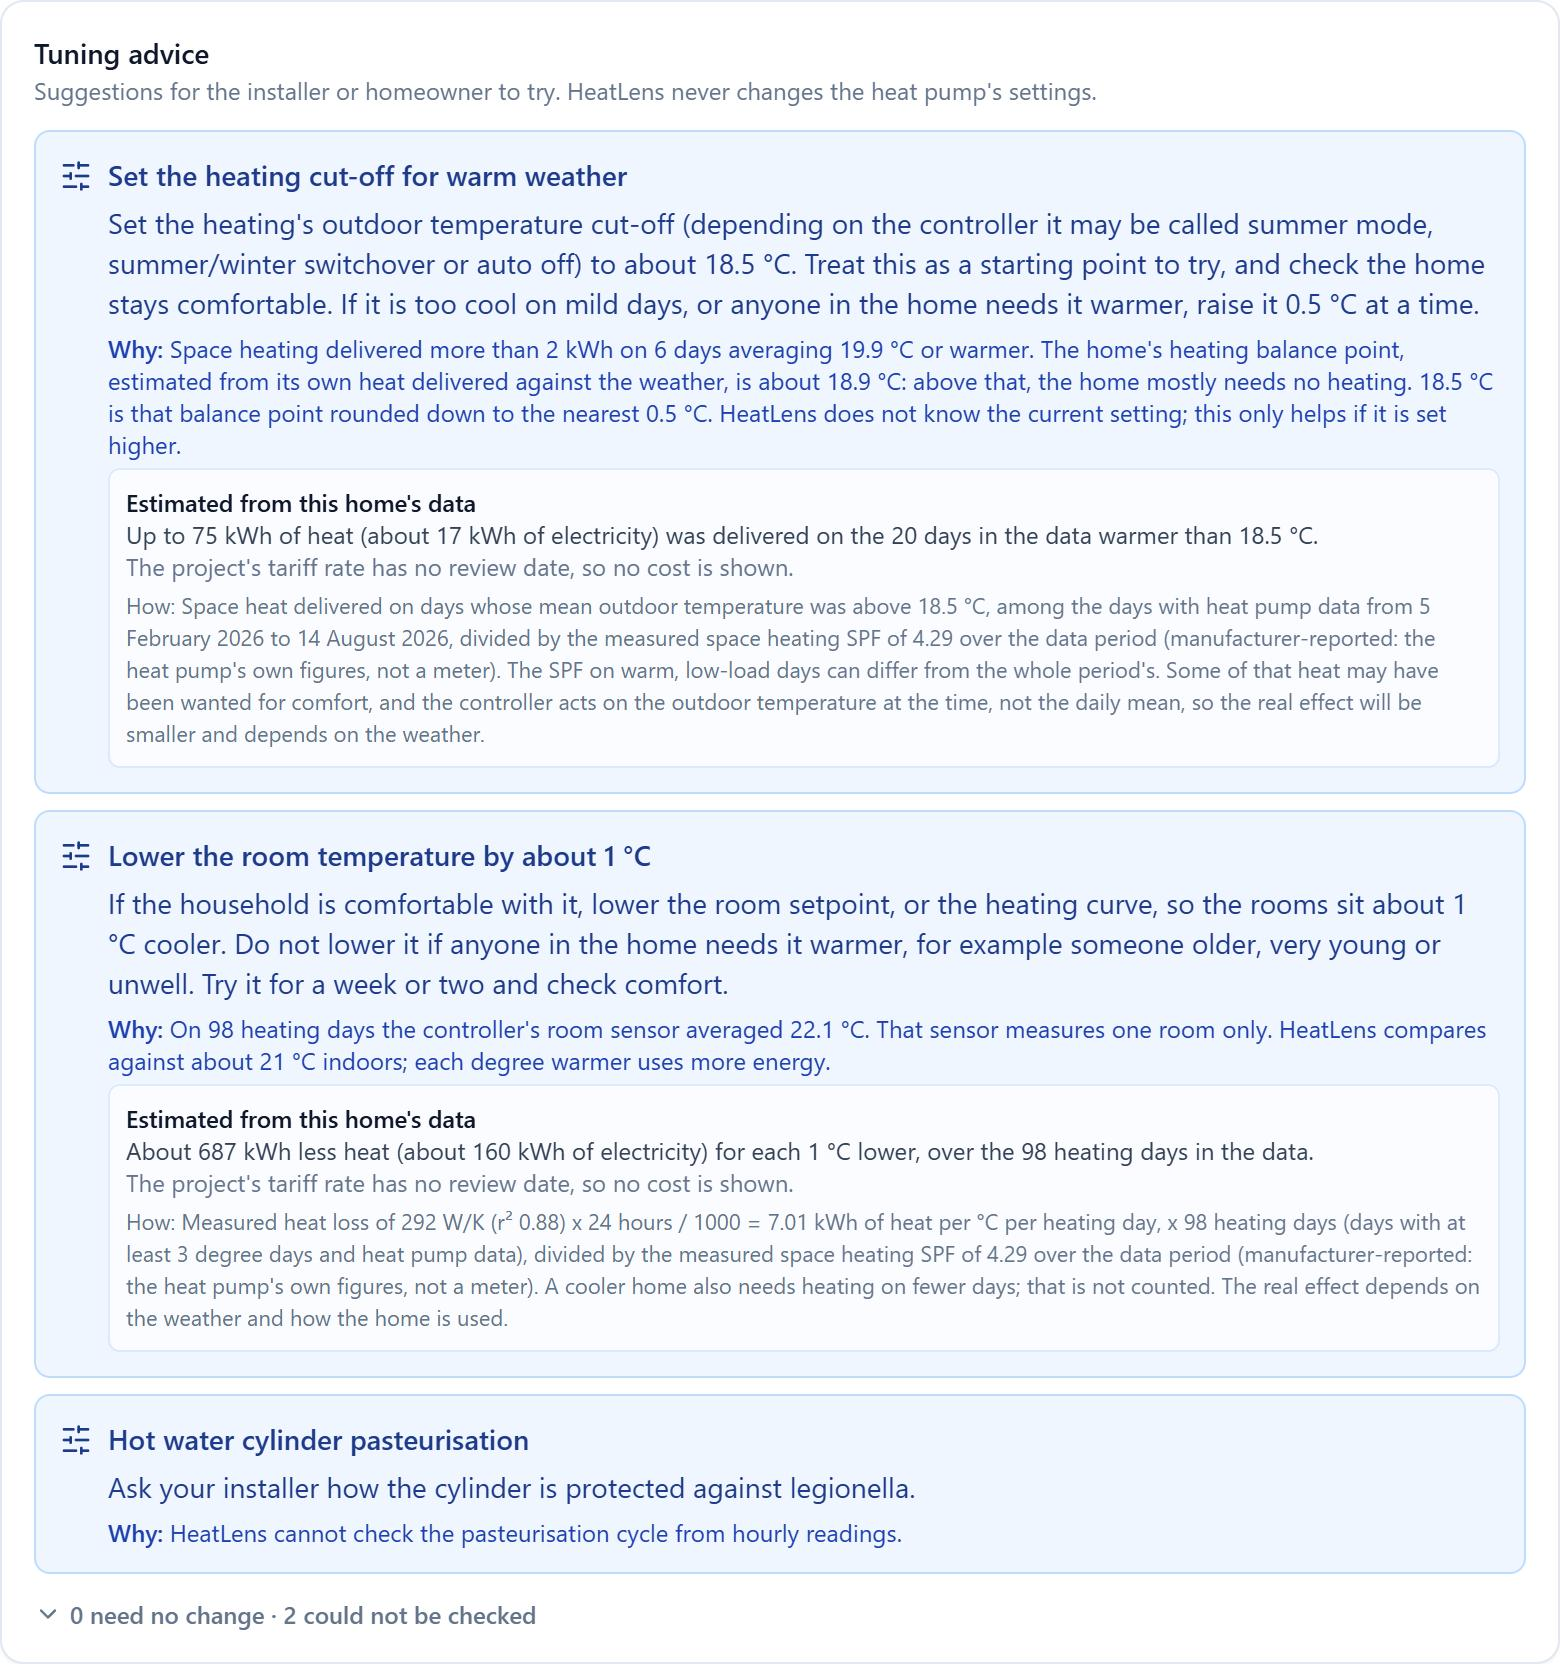
- Heating in warm weather. On 6 days averaging 19.9 °C or warmer, space heating still delivered more than 2 kWh. The suggestion is an outdoor cut-off of about 18.5 °C. Over the 20 days warmer than that, the heating used up to 75 kWh of heat, or about 17 kWh of electricity. That is small. The outdoor reading also comes from the unit's own sensor, which can read warm in sunshine.
- Rooms warmer than designed. The controller's sensor averaged 22.1 °C on heating days, against about 21 °C in the comparison. The tab suggests lowering the room temperature by about 1 °C. That would save about 687 kWh of heat, or about 160 kWh of electricity, over the 98 heating days. Here, the advice would be wrong. The sensor reads high because of where the control unit is mounted, and the rooms themselves sit at about 21 °C.
- A room below its setpoint. On 7 days in February and March, the controller's sensor averaged 6.3 °C below setpoint. Most of that comes from two days during the install and commissioning, just after the unit was powered on, when the sensor read 6 to 7 °C. The finding reflects the commissioning period, not a heating fault.
Both room findings rest on a single sensor. That is why every finding goes to the installer as a prompt to check with the household, not as an instruction.
 Source: HeatLens Performance tab, founder's home, 12 October 2026.
The room sensor's weekly readings show the settling-in period, and one round of the tuning loop above. After commissioning, the sensor read about 23.5 °C for five weeks against a setpoint of about 21 °C. In the week of 23 March, the founder lowered the heating curve. The sensor then settled at about 21.8 °C and stayed there.
Checking the effect is harder than making the change. In the four weeks either side, the space heating SPF moved from 4.33 to 4.37. Heat used per degree day did not fall measurably. The weather turned milder and sunnier, and four weeks of spring is too short and too noisy to put a number on one curve change. That is why monitoring needs to run for a full season, comparing like weather with like.
None of this is dramatic, and that is the point. This is a well-performing system. The checks still separate three kinds of question:
- a fabric question, now answered: the fabric matches the design;
- a settings question: the outdoor switch-off temperature;
- a data question: where the room sensor sits.
Every suggestion is advice. HeatLens never changes a heat pump's settings.
The whole-home view
With solar, a battery and an EV, the smart meter cannot tell you what the heat pump uses. In this home, 83% of grid import fell between 23:30 and 05:30, and the average import price from the supplier's own estimates was 7.2p/kWh. The heat pump's electricity has to come from the heat pump itself or a sub-meter, and each source is labelled with how it was measured.
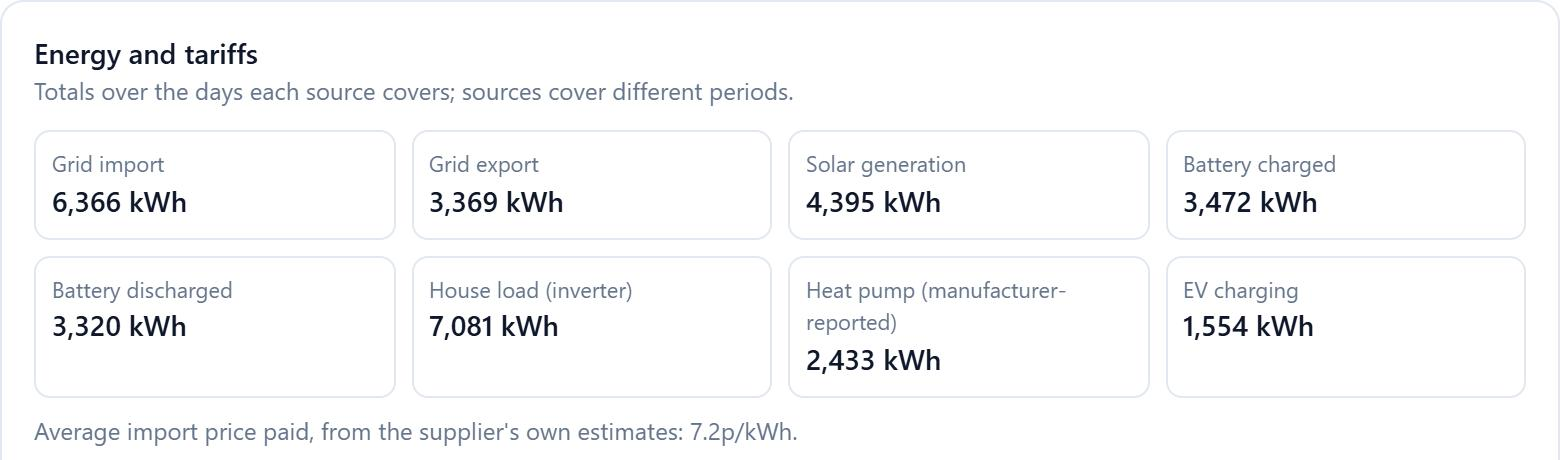 Source: HeatLens Performance tab, founder's home, 12 October 2026.
What the checks cannot see yet
The most common Bristol fault, weather compensation switched off, needs flow temperature readings over time to detect. The same goes for short cycling, which needs 5-minute data. The checks described here run on daily energy and hourly temperatures, and do not yet test for either. File exports from most controllers carry enough to start. A direct connection to the manufacturer's data would carry more.
What this means on a job
- Ask for data access at handover. Record the homeowner's consent, then get the controller's export or app access and the smart meter download.
- Look again at two to four weeks. The Carbon Trust's guide for social landlords recommends an early optimisation check in that window. Weather compensation and flow temperature are cheapest to fix while you are still in touch with the customer.
- Separate design from controls before you visit. If the measured heat loss matches the design, a high bill is a settings or usage question, not a sizing one.
- Label manufacturer figures. A controller's own heat and electricity estimates are useful for spotting trends. They are not a heat meter.
HeatLens's Performance tab is in pilot on our own home and is not yet open to customers. The design side, room-by-room heat loss and the design baseline it compares against, is on the features page. For why a high bill is often misdiagnosed as a sizing problem, see Heat pump expensive to run?. For installers, see HeatLens for designers and installers.
Sources
- Energy Systems Catapult for DESNZ, Electrification of Heat Demonstration Project: Insights from Heat Pump Performance Data, December 2024, Table 3.1 and section 3.7. Read 12 October 2026.
- Nesta with Bristol City Council (Woollard and Cretu), Optimising heat pump installations in social housing: findings from Bristol, 5 October 2026. Read 12 October 2026.
- Rosenow, Lea and Boni, "Bridging the efficiency divide: open-source insights into UK heat pump performance gap", Energy and Buildings 352, 116785 (2026), as reported by CIBSE Journal, "Bridging the heat pump efficiency divide", January 2026. Read 12 October 2026.
- Carbon Trust, Bristol City Council and University of Bristol, Improving heat pump outcomes in social housing: a practical action guide, April 2026, p.13. Read 12 October 2026.
- Founder's home: myVAILLANT export (manufacturer-reported), Octopus half-hourly consumption download and mySigen station export, 5 February to 14 August 2026, as analysed in the HeatLens Performance tab on 12 October 2026.